Let’s talk about Signals
Can you make unique and equally good predictions?

If you think Numerai’s main tournament is hard, then you might want to take a look at Signals! It’s more ambitious, and of course, harder! Signals provide a platform to evaluate your financial models and earn some NMR cryptocurrency too!
“Beating the wisdom of the crowds is harder than recognizing faces or driving cars” — Marcos López de Prado
If you are new to Numerai main tournament, this might help.
Just give me the code
This notebook has taken inspiration from the example_model.py and Jason Rosenfeld’s notebook.
From a Numerai participant’s perspective 💡
From the tournament perspective, the main difference between these two is the data. Numerai main tournament provides you obfuscated, clean, and normalized data in a supervised learning manner i.e, features + targets. Signals on the other hand gives only a list of symbols or tickers in the Bloomberg universe and historical targets. That means, we have to collect all the data that can be a good feature for prediction.
Think of this as Numerai giving a list of stock symbols(tickers) and asking a value (signal) in the range 0 to1 for every symbol in that list. We can look at historical prices, P/E ratio, volume, tweets, or any kind of data and then try to predict those values. A round in signals is resolved in a week, unlike 4 weeks for the main tournament.

In both the tournaments, your predictions are scored based on their correlation with live targets.You can stake on your prediction's goodness and uniqueness(optional) and get paid based on these scores.Payouts:
Numerai tournament: CORR (+ MMC)
Signals tournament: 2 * Corr (+ MMC)
Steps:
- List of tickers (symbols) in the latest round
- Get price data
- Perform Feature Engineering
- Modeling
- Prediction on the latest data
- Submission
The most important steps are getting quality data and feature engineering.
Tickers in the latest round
There are some changes in the list of tickers that the tournament asks for every week. Luckily, we have an API for that.

the tournament uses Bloomberg tickers for scoring.Getting historical data 📒
Historical financial data can be costly. But there’s a way we can get it for free.
A Jugaad (hack)😉: Free data can be downloaded using the yfinance library but it uses yahoo tickers. The idea is to,
- Load Bloomberg tickers
- Map them to yahoo tickers using a dictionary
- Load data using yahoo tickers
- Map yahoo tickers back to Bloomberg tickers
Once we have a list of tickers in the universe ∩ tickers available in yahoo mapping, we can start downloading the data.
Here’s a simple function of getting the prices for given tickers and starting date.

Feature Engineering 📐
Raw data needs to be structured and cleaned. we can try any data that seems somehow related to the changes.
Here, we need to transform this raw adj. close price data into something more expressive that we can feed to our model. Maybe taking the change in the last n-days, rolling average, putting daily volumes into log space, or combining the prices with volume data.
Let’s take the relative strength index (RSI) as one of the indicators. It indicates speed and change of price movements. RSI above 70 is considered overbought and under 30 is considered oversold. Another indicator used is, the simple moving average (SMA).
Bringing order to complexity
We need to learn the relative ranking of tickers in a given era. For that, converting these indicators to quintile labels can help. These quintile labels and their daily change of the past few days can be used as input features to the model.
- Calculate these scores
- group by date (era) and create quintile labels. i.e., for ranking tickers on a single date
- group by ticker and create lagged features. i.e.,
- get daily changes in these lagged features
It is like embedding a sense of relative ranking among tickers for a day and their relative performance over the past few days using lagged features.This seems a really good structure for getting started with modeling. However, this is just a way of feature engineering. You should combine other ways to get higher MMC.
At this point, we can see some similarity with Numerai’s main tournament! we just need targets in similar format.
Looking at the past
After collecting and engineering historical data, we need targets for those features. Numerai provides historical targets for training and evaluation purposes. On which, we can train our models in a supervised learning manner.
Think of this as asking your model to learn relation between input data you have engineered and the targets this tournament has provided. Two splits in targets data are for training (2003-2012) and evaluation (2013-Feb 2020).
We need to merge our features with targets on the same date and tickers.
The historical targets also seems quintile!
Building for the future
Let’s train a simple model.
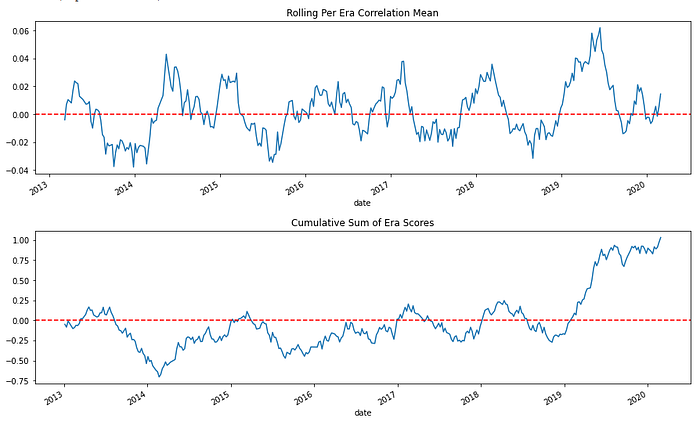
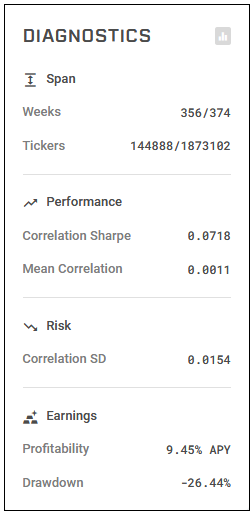
Evaluation
The predictions are evaluated based on the per-era correlation with targets. Here are some metrics we can immediately check our predictions on.
Future prediction
For submission, we take the data form last Friday before the round starts. This will have lagged features from the last 5 days and changes in them.
We can submit our prediction on validation data for historical Fridays to get the model evaluated by the historical evaluation tool provided by the tournament.
It needs to have the Friday date and data type in the columns. So, the final submission has both live and validation signals.
We can now upload this example_signal_upload.csv on the profile page or by using NumerAPI.
What’s next?
- Look for other indicators
- Try different modeling techniques
- Create and evaluate your own targets
- experiment and submit with more models
- Participate on RocketChat or Forum